绘图
ggplot2
可绘制:
expand_limits()
扩展坐标轴范围
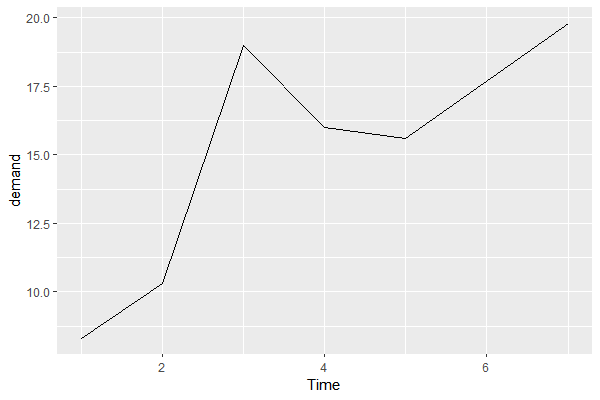
1 2 3 4 5 6 7 8 9 10 11 12 head( BOD) ggplot( BOD, aes( x = Time, y = demand) ) + geom_line( )
1 2 3 ggplot( BOD, aes( x = Time, y = demand) ) + geom_line( ) + expand_limits( y = 0 )
facet_grid()
分面条形图
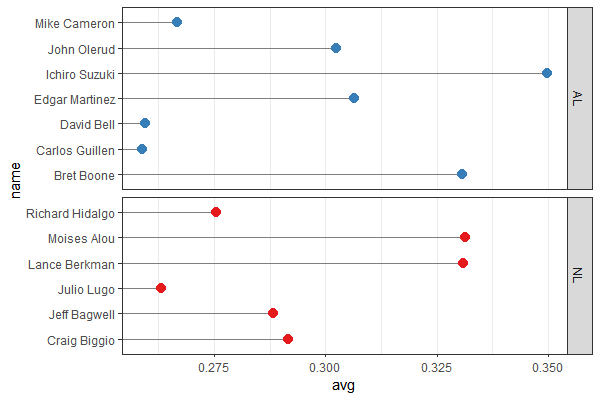
1 2 3 4 5 6 7 8 9 10 11 12 13 14 15 16 17 18 19 20 21 22 23 24 25 26 27 28 29 library( gcookbook) head( gcookbook:: tophitters2001) tophit = tophitters2001[ ( tophitters2001$ team == 'HOU' ) | ( tophitters2001$ team == 'SEA' ) , ] head( tophit) ggplot( tophit, aes( x = avg, y = name) ) + geom_segment( aes( yend = name) , xend = 0 , colour = 'grey50' ) + geom_point( size = 3 , aes( colour = lg) ) + scale_color_brewer( palette = 'Set1' , limits = c ( 'NL' , 'AL' ) , guide = FALSE ) + theme_bw( ) + theme( panel.grid.major.y = element_blank( ) ) + facet_grid( lg~ ., scales = 'free_y' , space = 'free_y' )
分面直方图
1 2 3 4 5 6 7 8 9 10 11 12 13 14 library( MASS) head( birthwt) ggplot( birthwt, aes( x = bwt) ) + geom_histogram( fill = 'white' , colour = 'black' ) + facet_grid( smoke ~ .)
1 2 3 4 5 6 7 8 9 10 11 birthwt1 = birthwt birthwt1$ smoke = factor( birthwt1$ smoke) levels( birthwt1$ smoke) library( plyr) birthwt1$ smoke = revalue( birthwt1$ smoke, c ( '0' = 'No Smoke' , '1' = 'Smoke' ) ) ggplot( birthwt1, aes( x = bwt) ) + geom_histogram( fill = 'white' , colour = 'black' ) + facet_grid( smoke~ .)
geom_area()
绘制面积图
百分比堆积面积图
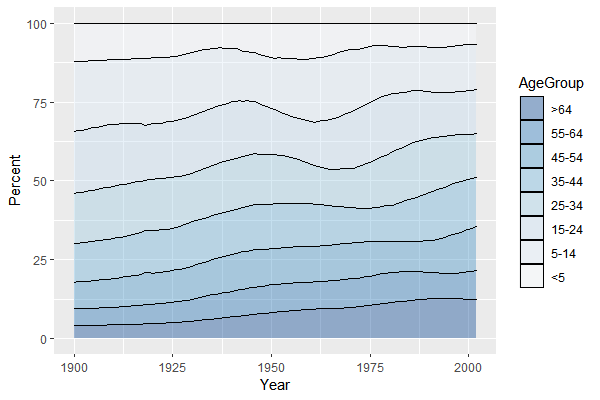
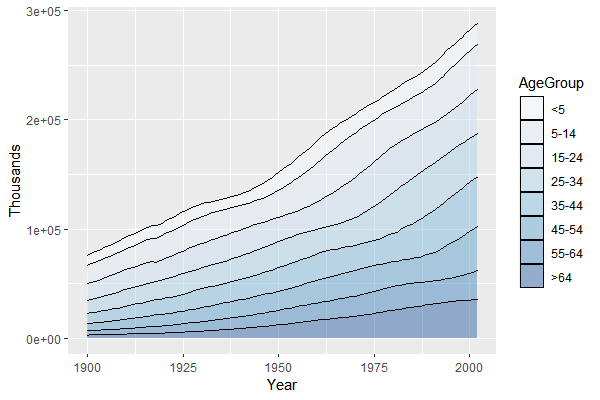
1 2 3 4 5 6 7 8 9 10 11 12 13 14 15 16 17 18 19 20 21 22 23 24 25 26 27 28 29 30 library( ggplot2) library( gcookbook) library( plyr) head( gcookbook:: uspopage) uspopage_prop = ddply( uspopage, "Year" , transform, Percent = Thousands / sum ( Thousands) * 100 ) head( uspopage_prop) p = ggplot( uspopage_prop, aes( x = Year, y = Percent, fill = AgeGroup) ) + geom_area( colour = 'black' , size = .2 , alpha = .4 ) + scale_fill_brewer( palette = "Blues" , breaks = rev( levels( uspopage$ AgeGroup) ) ) p
堆积面积图
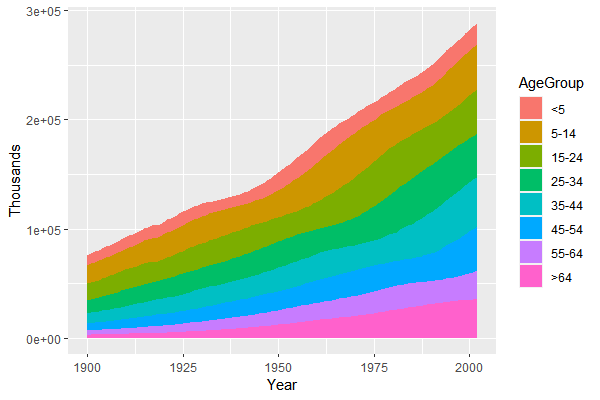
1 2 3 4 5 library( gcookbook) p = ggplot( uspopage, aes( x = Year, y = Thousands, fill = AgeGroup) ) + geom_area( ) p
1 2 3 4 5 6 7 8 9 library( plyr) library( gcookbook) library( ggplot2) p = ggplot( uspopage, aes( x = Year, y = Thousands, fill = AgeGroup, order = desc( AgeGroup) ) ) + geom_area( colour = 'black' , size = .2 , alpha = .4 ) + scale_fill_brewer( palette = 'Blues' ) p
面积图
1
2
3
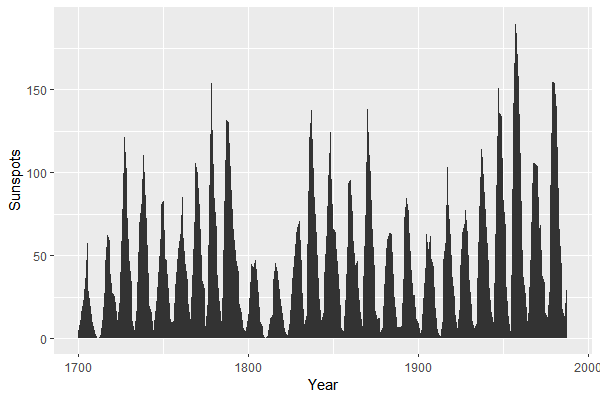
sunspotyear = data.frame( Year = as.numeric ( time( sunspot.year) ) , Sunspots = as.numeric ( sunspot.year) ) ggplot( sunspotyear, aes( x = Year, y = Sunspots) ) + geom_area( )
1
2
3
4
5
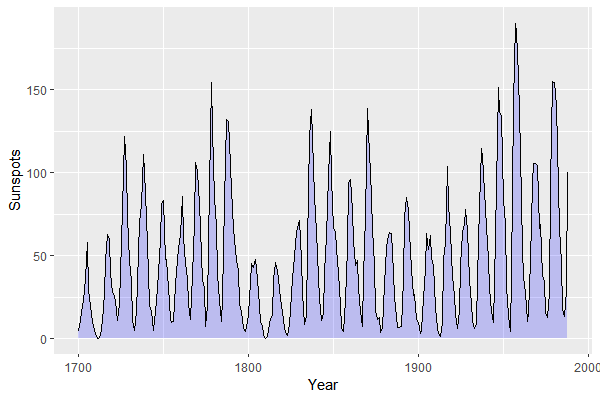
sunspotyear = data.frame( Year = as.numeric ( time( sunspot.year) ) , Sunspots = as.numeric ( sunspot.year) ) ggplot( sunspotyear, aes( x = Year, y = Sunspots) ) + geom_area( colour = 'black' , fill = 'blue' , alpha = .2 )
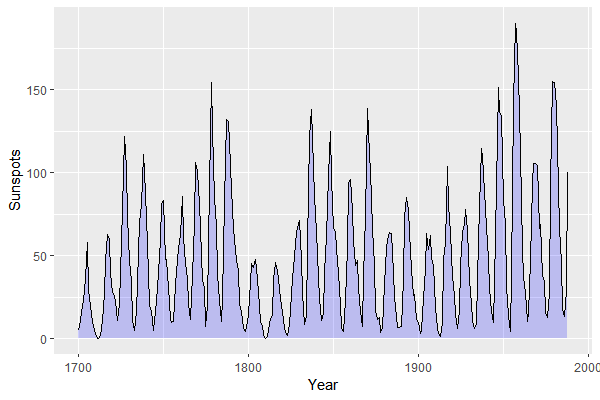
1 2 3 ggplot( sunspotyear, aes( x = Year, y = Sunspots) ) + geom_area( fill = 'blue' , alpha = .2 ) + geom_line( )
geom_bar()
绘制条形图
在aes()中将合适的变量映射到fill上,对条形设置着色
在scale_fill_brewer()或scale_fill_manual()中可重新设定图形颜色
width:设置条形宽度,默认值为0.9colour = 'black':为条形添加黑色边框线
条形图
1 2 3 4 5 6 7 8 9 10 11 12 head( BOD) ggplot( BOD, aes( x = Time, y = demand) ) + geom_bar( stat = 'identity' )
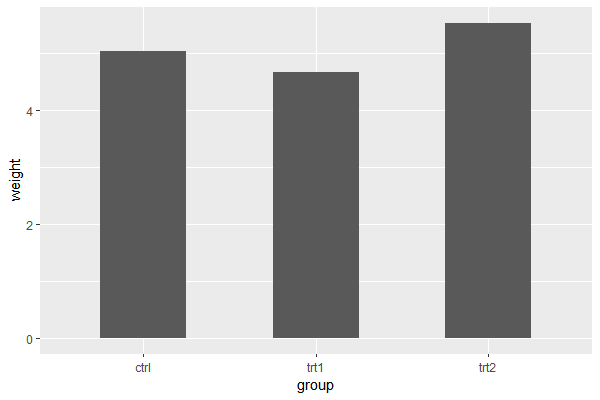
1 2 3 4 5 6 7 8 9 10 head( pg_mean) ggplot( pg_mean, aes( x = group, y = weight) ) + geom_bar( stat = 'identity' , width = 0.5 )
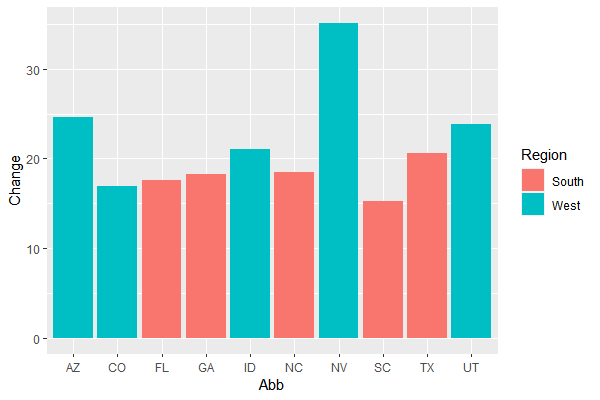
1 2 3 4 5 6 7 8 9 10 11 12 13 14 15 16 17 18 19 20 21 22 23 24 library( gcookbook) head( uspopchange) upc = subset( uspopchange, rank( Change) > 40 ) head( upc) ggplot( upc, aes( x = Abb, y = Change, fill = Region) ) + geom_bar( stat = 'identity' )
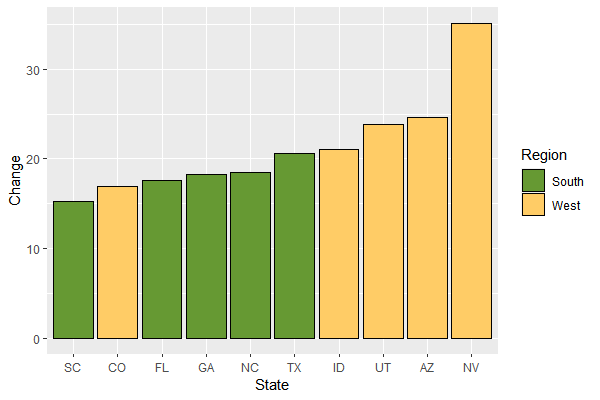
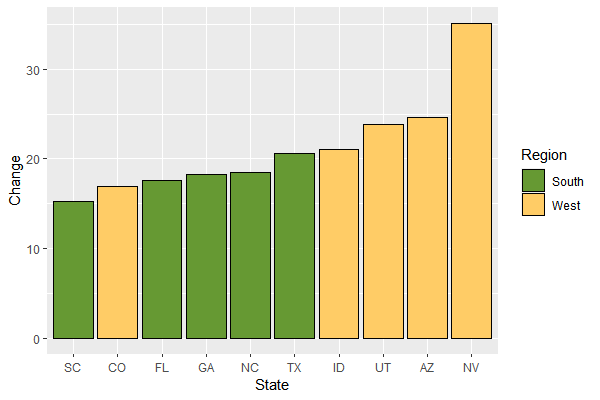
1 2 3 4 5 6 ggplot( upc, aes( x = reorder( Abb, Change) , y = Change, fill = Region) ) + geom_bar( stat = 'identity' , colour = 'black' ) + scale_fill_manual( values = c ( '#669933' , '#FFCC66' ) ) + xlab( 'State' )
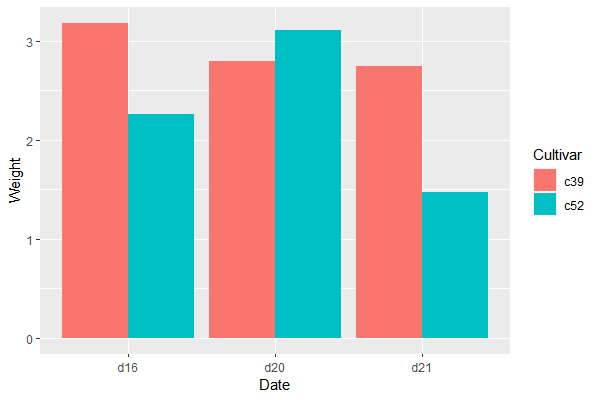
簇状条形图
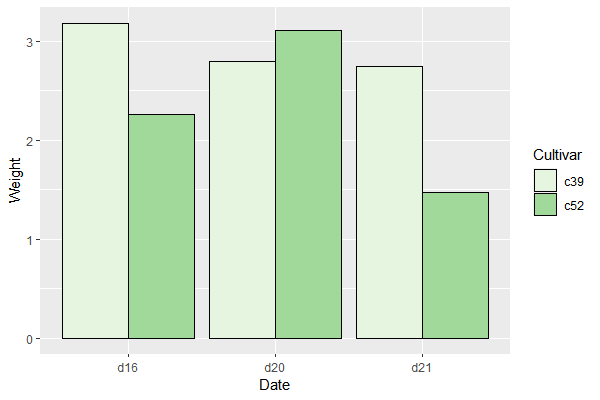
在x轴的分类变量上添加另一个分类变量一起对数据进行分组,将新增的分类变量映射给fill参数来绘制簇状条形图
需令参数position = 'dodge',使得两组条形在水平方向上错开排列
1 2 3 4 5 6 7 8 9 10 11 12 13 14 library( gcookbook) head( cabbage_exp) ggplot( cabbage_exp, aes( x = Date, y = Weight, fill = Cultivar) ) + geom_bar( position = 'dodge' , stat = 'identity' )
1 2 3 4 5 6 library( RColorBrewer) ggplot( cabbage_exp, aes( x = Date, y = Weight, fill = Cultivar) ) + geom_bar( position = 'dodge' , stat = 'identity' , colour = 'black' ) + scale_fill_brewer( palette = 'Pastell' )
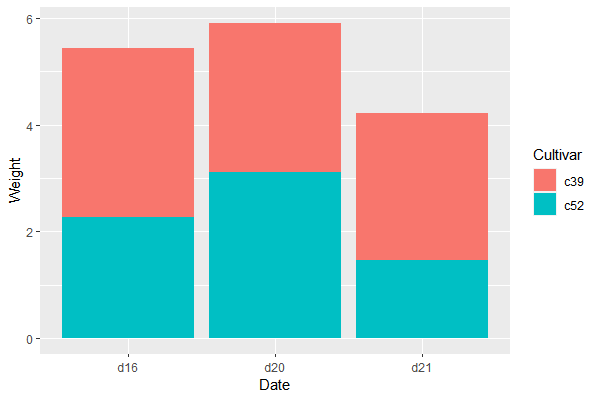
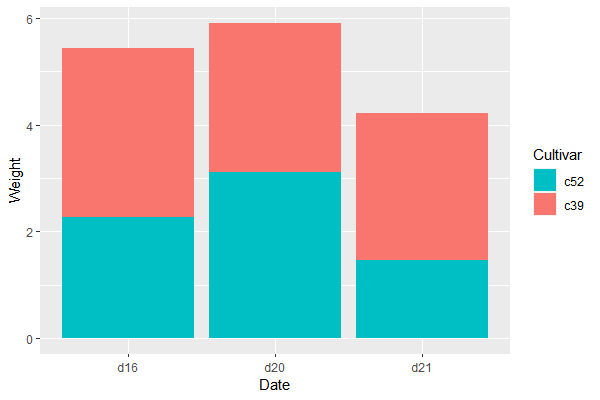
堆积条形图
1 2 ggplot( cabbage_exp, aes( x = Date, y = Weight, fill = Cultivar) ) + geom_bar( stat = 'identity' )
1 2 3 4 ggplot( cabbage_exp, aes( x = Date, y = Weight, fill = Cultivar) ) + geom_bar( stat = 'identity' ) + guides( fill = guide_legend( reverse = TRUE ) )
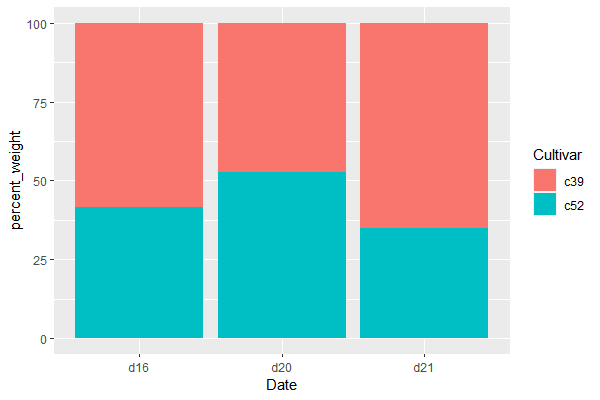
百分比堆积条形图
1 2 3 4 5 6 7 8 9 10 11 12 13 14 15 16 17 18 19 20 21 22 23 24 25 26 27 28 library( gcookbook) head( cabbage_exp) library( plyr) ce = ddply( cabbage_exp, 'Date' , transform, percent_weight = Weight / sum ( Weight) * 100 ) head( ce) ggplot( ce, aes( x = Date, y = percent_weight, fill = Cultivar) ) + geom_bar( stat = 'identity' )
频数条形图
正负条形图
geom_boxplot()
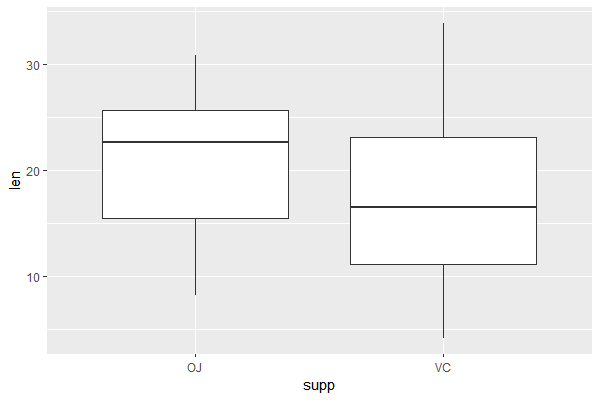
绘制箱线图
1 2 3 4 5 6 7 8 9 10 11 12 13 14 head( ToothGrowth) library( ggplot2) ggplot( ToothGrowth, aes( x = supp, y = len) ) + geom_boxplot( )
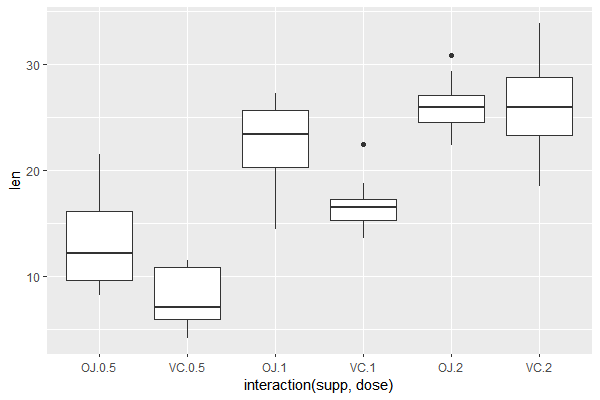
使用interaction()可以聚合多个分组变量,用于绘制多分组变量的箱线图
1 2 ggplot( ToothGrowth, aes( x = interaction( supp, dose) , y = len) ) + geom_boxplot( )
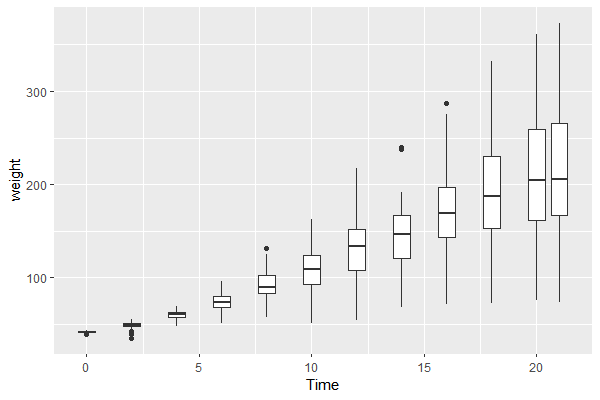
1 2 3 ggplot( ChickWeight, aes( x = Time, y = weight) ) + geom_boxplot( aes( group = Time) )
geom_density()
绘制密度曲线图
geom_histogram()
geom_line()
geom_point()
绘制散点图
geom_ribbon()
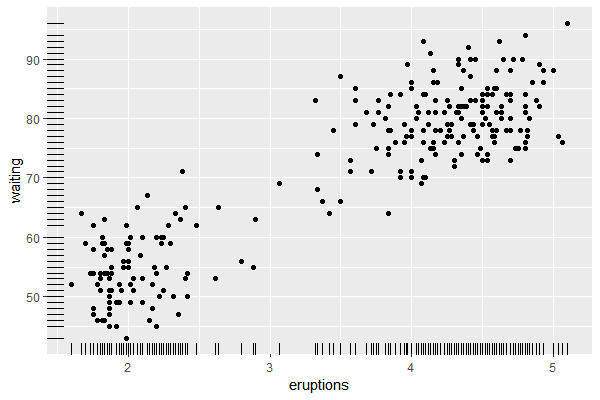
geom_rug()
1 2 3 4 5 6 7 8 9 10 11 12 13 14 15 head( faithful) library( ggplot2) ggplot( faithful, aes( x = eruptions, y = waiting) ) + geom_point( ) + geom_rug( )
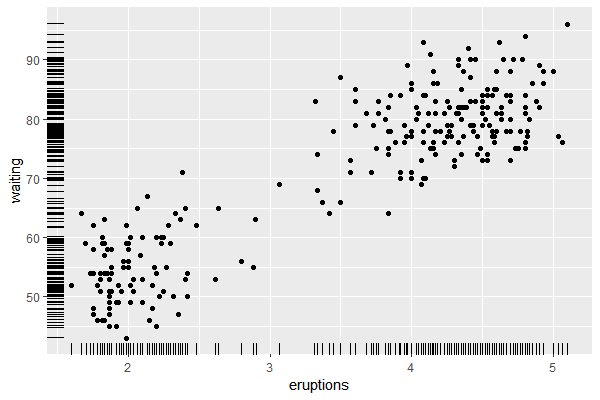
通过向边际地毯线的位置坐标添加扰动position并设定size减小线宽可以减轻边际地毯线的重叠
1 2 3 ggplot( faithful, aes( x = eruptions, y = waiting) ) + geom_point( ) + geom_rug( position = 'jitter' , size = .2 )
stat_function()
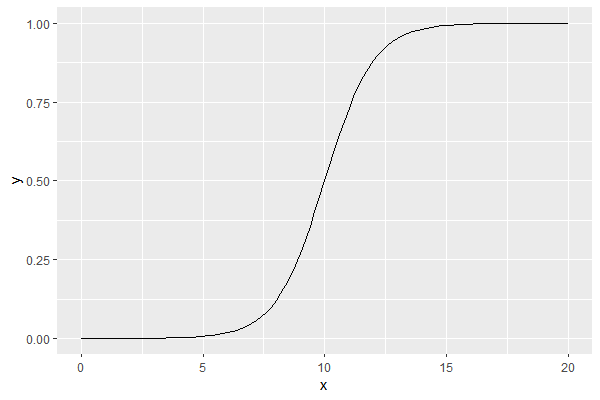
绘制函数图像
1
2
3
4
5
6
7
myfun = function ( xvar) { 1 / ( 1 + exp ( - xvar + 10 ) ) } library( ggplot2) ggplot( data.frame( x = c ( 0 , 20 ) ) , aes( x = x) ) + stat_function( fun = myfun, geom = 'line' )
参考资料
Thank you for your approval.
打赏
支付宝
微信支付
WeChat Bezahlung
