1
2
3
4
5
6
7
8
9
10
11
12
13
14
15
16
17
18
19
20
21
22
23
24
25
26
27
28
29
30
31
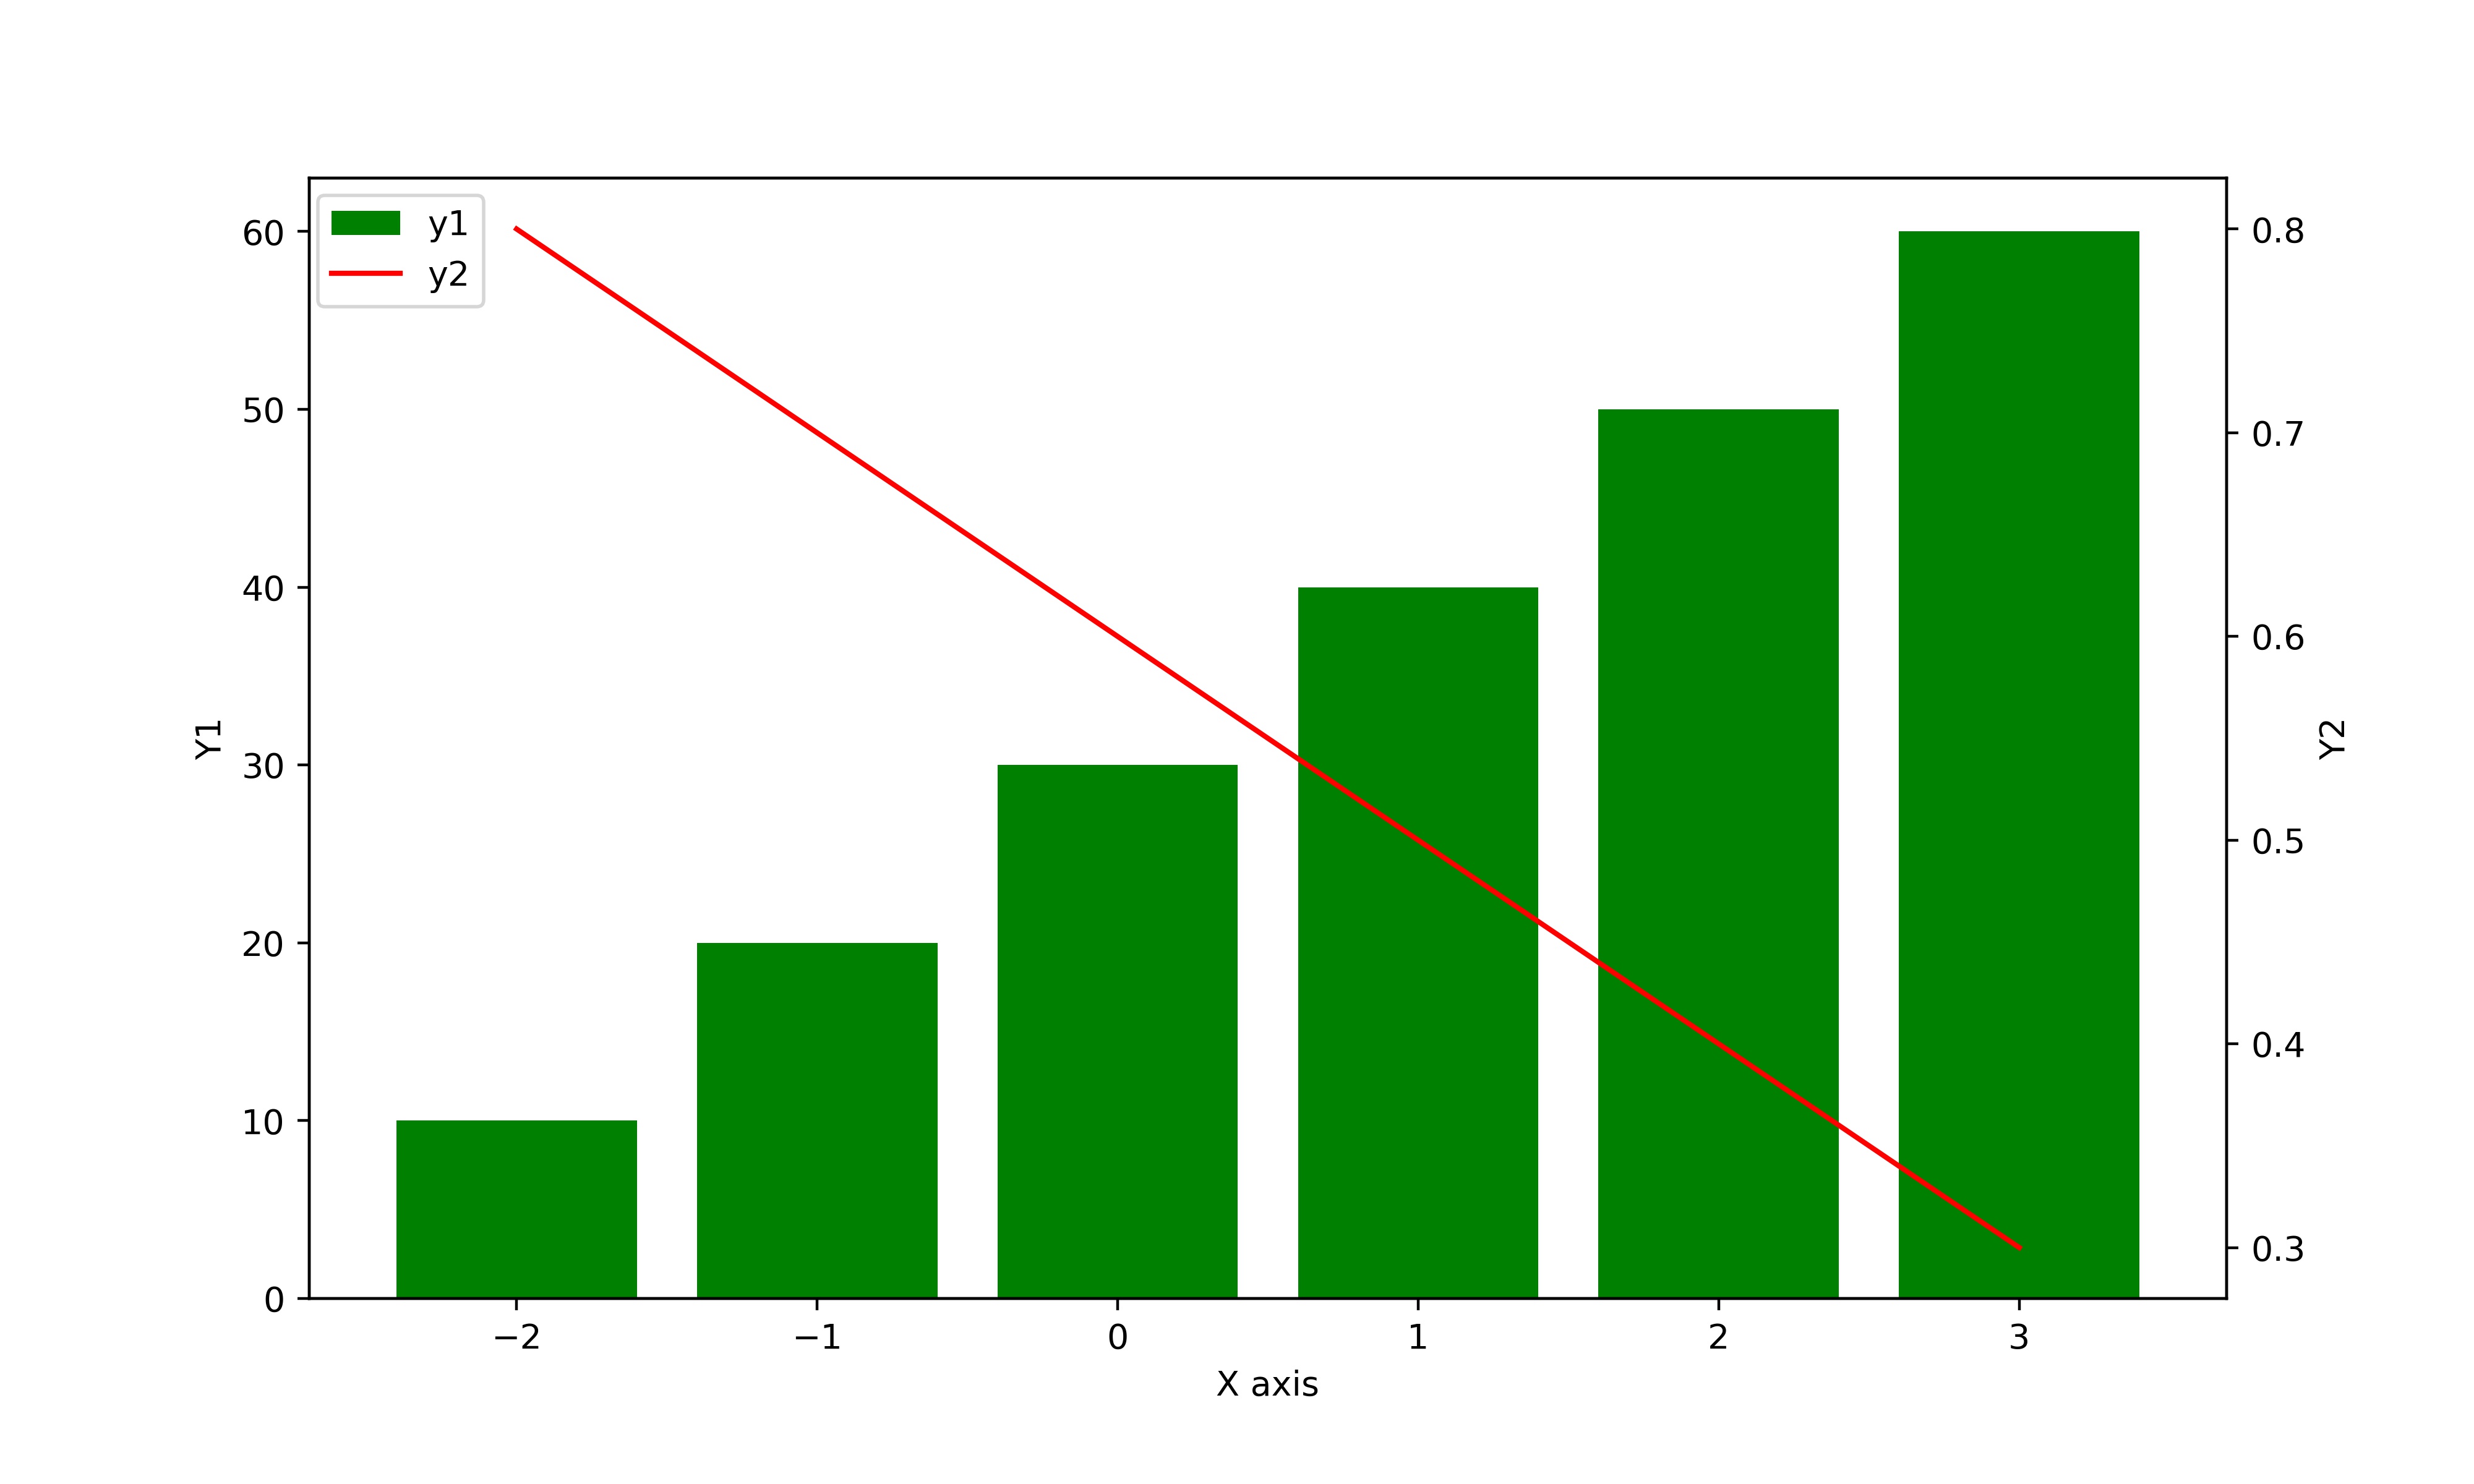
| import matplotlib.pyplot as plt
import pandas as pd
df = pd.DataFrame([
[-2, 10, 0.8],
[-1, 20, 0.7],
[0, 30, 0.6],
[1, 40, 0.5],
[2, 50, 0.4],
[3, 60, 0.3]
], columns=['x', 'y1', 'y2'])
fig = plt.figure(figsize=(10, 6))
ax1 = fig.add_subplot(111)
ax1.bar(df.x, df.y1, color='g', label='y1')
ax2 = ax1.twinx()
ax2.plot(df.x, df.y2, color='r', label='y2')
fig.legend(loc=1, bbox_to_anchor=(0.1, 1), bbox_transform=ax1.transAxes)
ax1.set_xlabel(r"X axis")
ax1.set_ylabel(r"Y1")
ax2.set_ylabel(r"Y2")
plt.savefig('Twin_Xaxes.jpg', dpi=400)
plt.show()
|